Somebody is going to ask what the AI budget bought. It might be a CFO before the next planning cycle, a board member who read that competitors are further along, or a procurement lead staring at a renewal for a tool that nobody can confirm anyone opened. The question arrives eventually, and it arrives in a form that a demo cannot answer.
The software built to answer it has been grouped under a single label, and the label is doing more work than it can carry. One platform in this category will tell you what your inference bill was last month, broken down by model and by team. Another will tell you which departments have actually adopted the assistant you rolled out, and which ones quietly stopped using it in week three. A third reads the conversations employees have with your agents and reports whether they finished the task they came to do. Those are three different products answering three different questions, and a buyer who treats them as substitutes ends up with a tool that measures something they were not asking about.
This guide breaks AI ROI into the metrics that platforms actually track, organized into four layers. The point is to let a team decide what it needs to prove before it starts comparing feature lists, which is the reverse of how most of these purchases happen.
Why AI ROI Metrics Exist Now
The category exists because spending outran the accounting for it. Accenture's Pulse of Change survey, which polled 3,650 executives, found that 86% of C-suite leaders plan to raise AI investment this year. Only 32% reported sustained, enterprise-wide impact from the AI they had already deployed. Seventy-eight percent expect AI to drive revenue growth, while 21% have redesigned a core business process around it and fewer than one in ten have changed the roles of the people doing that work. The money is committed. The operational changes that would convert it into a measurable return are running well behind.
Tom Bruss, a managing director at Accenture, put the operational half of the problem in a line reported by Forbes contributor Melody Brue at ServiceNow's Knowledge 2026 conference. He said that applying AI to an inefficient process automates the inefficiency. That is a fair description of what a lot of enterprise AI spending has purchased so far, and it is also a description of a measurement problem, because a company that cannot see which processes its AI is touching has no way to know which of them were worth automating.
The structural failure sits one level below the survey numbers. A report from the software firm Lanai, covered by Forbes contributor Güney Yıldız in June, found that 92% of technology executives watch AI-generated work in some form while only 2% formally record even half of it as a business outcome. Ninety percent of the organizations surveyed had no dedicated function measuring AI's return at all. Seventy-nine percent worried about budget cuts precisely because they could not prove the value of what they had already spent. And 87% of AI-assisted output is credited to a human employee alone, which means the software's contribution never enters any performance number the business already keeps.
Read those together and the shape of the problem is clear. Most companies are not failing to measure AI's return because they lack a dashboard. They are failing because the systems that record work, cost, and output were built before AI was doing any of the work, and nobody has rebuilt them.
Two things broke the old methods
The first is agents. When AI was a text box that a person typed into, the cost of a session was the cost of the tokens, and the token bill was a reasonable proxy for what AI was costing the company. Agents ended that. An agent handling a loan origination workflow might spend thirty cents on model tokens while pulling a credit report that costs between $35 and $75, running an identity check, querying a fraud score, and verifying a bank account. Those charges arrive on separate invoices from separate vendors with no link back to the agent decision that triggered them. A company measuring its AI cost by counting tokens is, in that scenario, seeing well under one percent of what the workflow actually cost.
The second is scale. One team with a handful of assistant licenses can be managed by hand, and the manager can tell you off the top of their head who is using what. Two hundred employees running agents across a dozen tools, half of those tools bought on a corporate card without a purchase order, cannot be managed that way. Past a certain point the questions that matter, meaning what are we spending, who is using it, and what did it produce, stop being answerable from memory and start requiring instrumentation.
"A company that cannot see what its AI is doing has no honest way to report a return on it, and no basis for deciding whether to spend more."
Nathaniel Niyazov,
CEO, Founder GetAIGovernance
The AI ROI Metrics Framework
AI ROI platforms are built around metrics. A metric here means a continuous measurement against a defined dimension of AI cost, usage, or output. It is different from a report, which summarizes, and different from an alert, which fires on a threshold. Teams that understand which metrics they need understand what these platforms are actually selling, which is a prerequisite for buying one that fits.
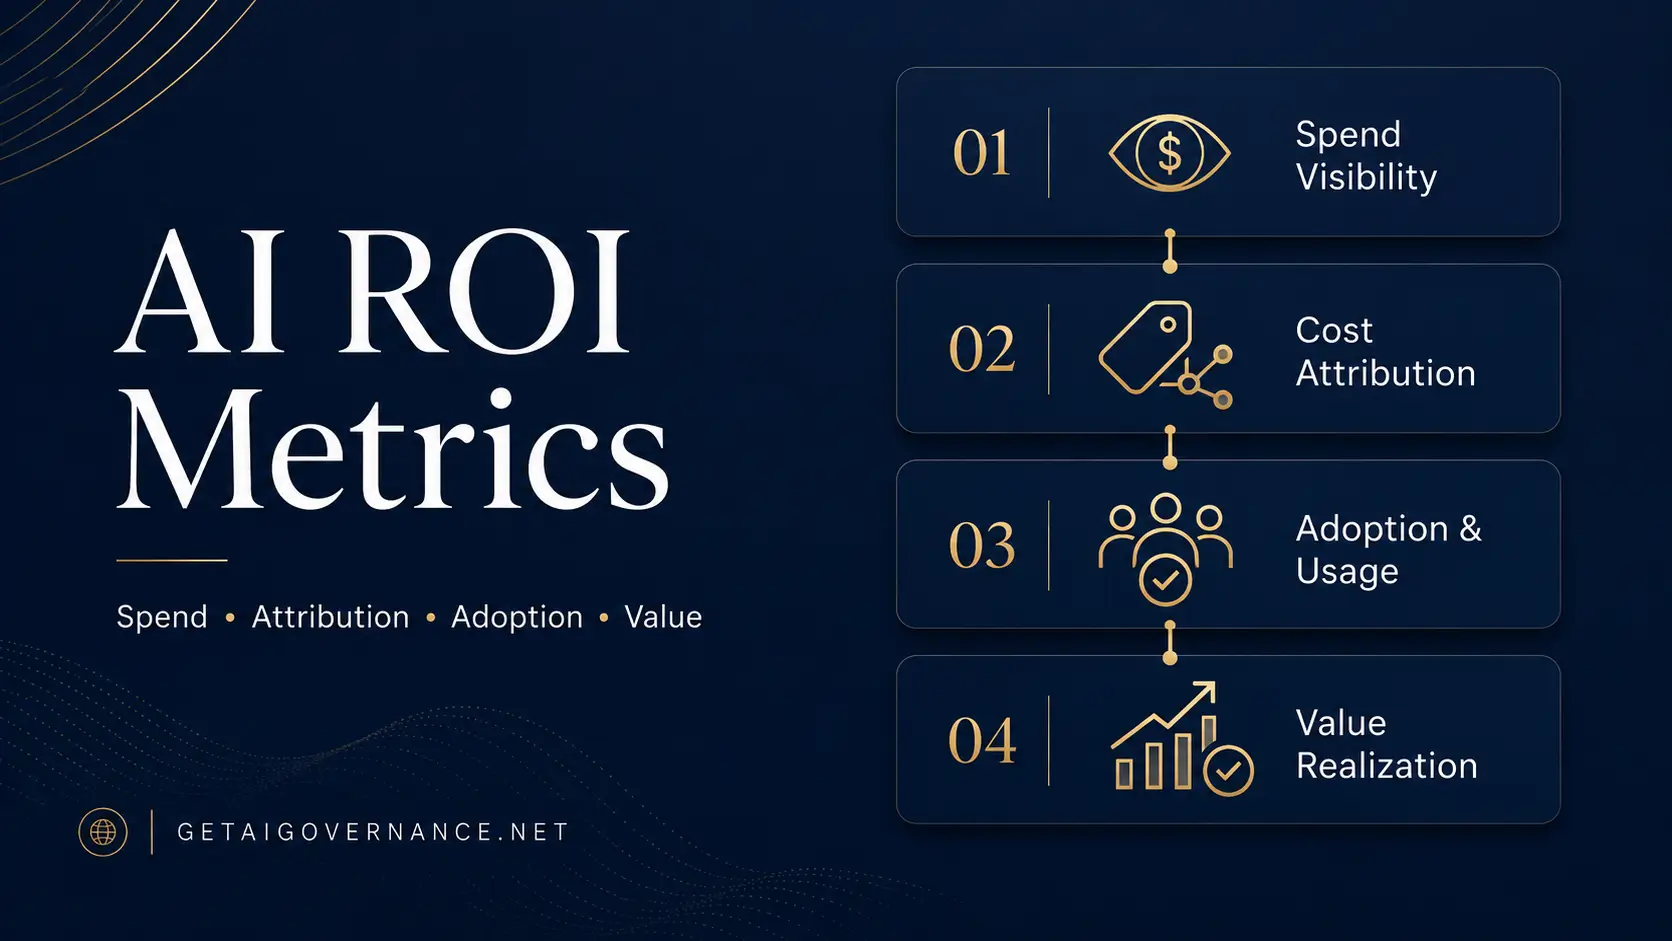
The metrics fall into four layers.
Spend Visibility answers what the organization is spending on AI, across every source, including the sources nobody registered. Cost Attribution answers whose spend it is and what caused it, tying each dollar to a team, a feature, a customer, or an agent decision. Adoption and Usage answers who is actually using the AI that was bought, how capably, and which purchased seats are sitting idle. Value Realization answers what the usage produced, converted into a figure that a finance team will accept, and adjusted for what the failures cost.
The layers stack, and the order is load-bearing. Spend that cannot be seen cannot be attributed to an owner. Adoption cannot be judged for a tool whose cost was never attributed to the team using it. And value cannot be proven without knowing who adopted what and at what cost. Organizations that skip to the fourth layer, which usually means asking a department head to estimate how many hours AI saved the team, produce numbers that collapse under the first serious question from finance. The estimate has no baseline behind it, no observed data supporting it, and no accounting for what the tool cost to run or to govern.
Spend Visibility: What Are We Actually Spending?
The foundation layer, and the one that most organizations assume they have already solved because they can open a billing console. The billing console shows what the company knows it bought. Spend visibility means finding everything, including the spend that never went through procurement.
Total AI Spend Across Every Source
A single figure covering model API charges, per-seat licenses, cloud and compute costs for self-hosted models, and the AI features bundled into software the company already pays for. The figure is harder to produce than it sounds because AI spending enters an organization through at least four different doors: engineering buys API credits, IT buys enterprise licenses, individual departments buy tools on a card, and existing SaaS vendors add AI features to contracts that were signed before AI features existed.
The practical test is whether anyone in the company can answer the total in under an hour without opening more than one system. In most organizations the honest answer is that the number does not exist anywhere, because no single system was ever given the job of holding it.
Spend by Tool, Vendor, and Model
The breakdown underneath the total, split by which product and which underlying model the money went to. Model-level detail matters more than it did a year ago, because the price gap between model tiers is wide enough that routing decisions carry real budget consequences. A workflow that quietly defaults to a frontier model for a task a cheaper model handles perfectly well will not produce an error, and it will produce a bill.
License and Seat Spend
What the company is paying for AI seats, including the ones bought by individual teams outside the central IT budget. Seat spend is the easiest AI cost to see and the most commonly wasted, because a seat purchased in a rollout keeps billing whether or not anyone opens the tool. The metric to watch is the count of paid seats, which is then compared against active usage in Layer 3.
Infrastructure and Compute Spend
For organizations running models themselves, the GPU hours, memory, storage, and networking that inference and fine-tuning consume. Self-hosted deployments trade a predictable per-token charge for a variable infrastructure bill that responds immediately to configuration decisions, which means a misconfigured setting can produce a cost increase that no usage change explains.
Shadow AI Spend
The AI the company is paying for that finance does not know about. Employees expense subscriptions. Teams sign up for a tool on a credit card because procurement would have taken six weeks. Vendors add AI capabilities to existing contracts. Every one of those is real money leaving the business, and none of it appears in the AI budget line, which means every return calculation built on that budget line is being divided by the wrong denominator.
Burn Rate and Trend
Month-over-month movement in AI spend, tracked at a granularity that allows a spike to be traced to a cause. Consumption-priced AI does not behave like a software license. It scales with usage, and usage scales with product changes, prompt changes, and user behavior in combinations that are difficult to forecast. A team that reviews AI cost quarterly will discover problems in a billing statement. A team that tracks burn rate weekly will discover them while they can still be fixed.
Cost of AI Failures and Incidents
The money spent cleaning up after AI that went wrong. This includes the hours a person spends reworking a fabricated output before it reaches a client, the engineering time consumed by an agent that took an action it should not have taken, and the incident response cost when an AI system becomes a security event. CrowdStrike's 2026 Global Threat Report documented attacks at more than 90 organizations during 2025 in which intruders fed malicious instructions into generative AI tools to steal credentials and cryptocurrency, and recorded an 89% year-over-year rise in activity from AI-enabled attackers. Those events carry a cost, and that cost belongs in the denominator of any honest return calculation.
Almost nobody tracks this metric today. It is the single largest omission in the way AI return is currently reported, and it is the reason a return figure produced by a cost tool and a return figure produced by a risk team can differ by an order of magnitude while both being calculated correctly.
Cost Attribution: Whose Spend Is It, and What Caused It?
Knowing the total tells a CFO how much AI cost. It does not tell anyone whether it was worth it, because worth is a ratio and a ratio needs a denominator that belongs to something. Attribution is the work of assigning every dollar to the thing that caused it, and it is where the intellectual content of this category lives.
Cost per Team, Department, and Business Unit
The allocation that makes AI spending governable. Until a cost sits on a specific team's ledger, no one on that team has any reason to care what it is. Attribution to a business unit is what turns AI from a central IT line item that nobody owns into a cost that a named person answers for, which is the same move that made cloud spending manageable a decade ago.
Cost per Feature and per Product
What each AI-powered capability costs to run. A product team that has shipped an AI summarization feature needs to know what that feature costs per use, because the answer determines whether the feature can be offered on a lower pricing tier, whether it needs a usage cap, and whether it should exist at all. Feature-level cost is also the number that surfaces the AI capability that consumes forty percent of the inference budget while serving three percent of users.
Cost per Customer
The metric that protects gross margin, and the one that turns AI cost into a business number rather than a technology number. A software company serving customers with AI features embedded in the product has a cost of goods sold that now moves with how heavily each customer uses those features. Without cost-per-customer visibility, a company can sign an enterprise deal that is unprofitable from the first day and not find out for two quarters.
Cost per Agent
In multi-agent deployments, the allocation of spend to each agent in the pipeline. Costs in an agent workflow aggregate across the whole chain, which means a spike shows up as a larger bill without any indication of which of five agents caused it. Per-agent attribution is what allows a team to identify the agent responsible rather than auditing the entire pipeline. It is also the metric that answers whether a specific agent deployment is earning its keep, which is a question that will be asked about a lot of agents over the next year.
Cost per Task, Transaction, or Decision
The unit economics of the work itself. What does it cost to resolve one support ticket, review one contract, or process one claim with AI in the loop? This is the figure that permits a genuine comparison against the cost of doing the same work without AI, which is the comparison a CFO is actually asking for when they ask about return.
Token Cost Versus Non-Token Cost
The metric that almost no organization tracks and that almost every agentic workflow requires. The intuition that AI cost equals token cost was formed when AI meant a chat interface, and it has not survived contact with agents that call external tools.
Consider a loan origination agent. The model reasoning across the workflow might consume thirty cents in tokens. Along the way the agent pulls a credit report, which costs somewhere between $35 and $75 depending on the bureau and the product. It runs an identity verification check. It queries a fraud score. It verifies a bank account through an aggregator. Each of those calls carries a per-transaction charge from a different vendor, and each arrives on a separate invoice at the end of the month with no field connecting it back to the agent decision that triggered it. The token cost, which is the only cost most teams are watching, represents well under one percent of what that workflow actually consumed.
The same pattern holds anywhere an agent touches a metered external service, which increasingly means anywhere an agent does useful work. Data enrichment APIs, document processing services, search APIs, payment rails, and the growing population of MCP servers all charge per call. So does human review, when a workflow routes an output to a person for approval, and the loaded hourly cost of that person is a real input that belongs in the same trace as the model call that produced the output.
An organization that measures its AI cost by counting tokens and then calculates a return against that figure is dividing a real benefit by a fictional cost. The resulting number will look excellent, and it will not survive anyone who checks.
Untagged and Shared Cost Allocation
The portion of AI and cloud spend that cannot be assigned to an owner through conventional tagging, because the infrastructure is shared, the tags were never applied, or the workload is multi-tenant. In most enterprise environments this is a large fraction of the total, and the standard response has been a tagging cleanup project that never finishes. The platforms in this category that matter are the ones that allocate untagged spend without waiting for that project to complete, because a company that can only account for sixty percent of its AI cost has an unusable return figure regardless of how precisely it measured the other forty.
Chargeback and Showback
The mechanism that pushes attributed cost back to the business unit consuming it, either as a report (showback) or as an actual internal charge (chargeback). Showback changes behavior through visibility. Chargeback changes behavior through a budget line. Both require the attribution work in this layer to be trustworthy enough that the receiving department cannot dispute the number, which is a higher bar than internal reporting usually clears.
Cost of Governance and Oversight
What it costs to govern the AI, as distinct from what it costs to run it. Every risk assessment, model review, policy exception, audit preparation cycle, and human approval gate consumes staff time, and that time is a real cost of the AI program that no vendor invoice will ever show. A compliance team that spends forty hours preparing documentation for one AI system under an examination cycle has spent real money on that system, and that money belongs in the same denominator as the inference bill.
This metric is almost entirely absent from the current market. Cost platforms measure what vendors charge. They do not measure what the company spends on itself in order to deploy AI responsibly, which means every published AI return figure is currently understating the true cost by whatever the governance overhead happens to be. For organizations in regulated industries, that overhead is not small.
Adoption and Usage: Who Is Actually Using This?
The layer that sits between cost and value, and the one that explains most of the gap between them. An AI tool that nobody opens costs exactly as much as an AI tool that transforms a department. The difference between the two shows up here, and nowhere else.
Active User Rate and License Utilization
The share of purchased seats that are being used, measured against a definition of "used" that means something. A user who opened the tool once in the last thirty days is not an active user in any sense a CFO would accept. Utilization tracked against a meaningful activity threshold is the number that determines whether a renewal is justified.
Shelfware Rate
The inverse, and the number that pays for the platform on its own in most deployments. Seats purchased in an enthusiastic rollout and never opened continue to bill monthly, and the only thing standing between a company and that waste is somebody counting. Shelfware is the first thing to look for before a renewal, and it is the easiest cost to recover.
Adoption by Department, Role, and Geography
The breakdown that shows where a rollout landed and where it stalled. Adoption is rarely uniform. Engineering picks up a coding assistant in a week while legal never opens it, and the aggregate adoption figure hides both facts. Segment-level adoption data is what tells a program lead which teams need training, which teams need a different tool, and which teams should have their licenses reassigned.
Depth of Use
The distinction between a person who has the tool open all day and a person who tried it twice in March. Frequency, session count, and task volume separate genuine reliance from occasional curiosity. Depth of use is the leading indicator of value, because a tool that people depend on is producing something, and a tool that people visit occasionally is not.
AI Fluency and Proficiency
How capably people are using the AI they have. Two employees with the same license and the same task can get very different results depending on how well they prompt, how they structure a request, and whether they know what the tool is capable of. Fluency scoring identifies the teams where the tool is present and the skill is missing, which is a training problem rather than a tooling problem, and it is one of the few AI ROI findings that leads directly to a cheap fix.
Use Case Discovery
What people actually bring to the AI, as opposed to what the rollout deck assumed they would. The gap between the two is routinely large. A company deploys an assistant for research summarization and discovers that most of the traffic is people asking it to write emails. That finding matters for two reasons. It tells the program lead what the real demand is, and it tells them where the next deployment should go.
Abandonment Rate
The share of users who tried the tool and stopped. Abandonment is more informative than adoption, because a person who used a tool and gave up encountered something specific, and that something is usually a quality problem, a workflow mismatch, or a trust failure that will repeat with the next group.
Where quality belongs. Hallucination rate, output accuracy, and error rate are monitoring signals, and they are defined in the AI monitoring signals framework rather than here. AI ROI measurement consumes those signals as an input rather than producing them. The connection runs in one direction: a monitoring platform reports that a system fabricates a citation in three percent of outputs, and the ROI layer converts that rate into a cost by pricing the rework it causes. That conversion happens in Layer 4. Treating quality signals as ROI metrics in their own right would duplicate the monitoring layer and obscure the thing that makes the two categories distinct, which is that monitoring measures behavior and ROI prices it.
Value Realization: What Did It Produce?
The layer everyone wants to skip to, and the layer that only works if the three beneath it are in place. Value realization converts AI activity into a figure that finance will accept, and the work of this layer is mostly the work of making that figure survivable.
Time Saved
Hours returned to a person by the AI doing work they would otherwise have done. This is the most commonly reported AI benefit and the most commonly overstated, for reasons covered in the next section. Measured well, it comes from observed system data comparing task completion time before and after the tool arrived. Measured badly, it comes from asking people how much time they think they saved.
Dollar Value of Time Saved
Hours converted into money using a loaded labor rate. This is the step where a productivity claim becomes a financial claim, and it is the step where most AI return figures acquire their credibility problem, because multiplying a soft number by a hard number produces a number that looks hard and is not.
Task Completion and Success Rate
Whether the person or the agent actually finished what they set out to do. This is an outcome measure rather than a satisfaction measure, and the difference matters. A user can rate an interaction highly and still have failed to accomplish the thing they came for. Completion rate, tracked at the task level, is the closest thing this category has to a ground truth for whether the AI is useful.
Output Volume and Rework Rate
How much work the AI produced, and how much of it a human had to fix. Rework rate is the metric that connects to the monitoring layer, because it is where output quality becomes a cost. An AI that drafts twice as many documents while requiring a human to substantially revise each one has not saved the time it appears to have saved, and the rework rate is what surfaces that.
Cycle Time Reduction
How much faster a process runs end to end with AI in it. Cycle time is a stronger measure than time saved per person, because it captures the whole workflow rather than one participant's experience of it, and because it is measured from system timestamps rather than from a survey.
Revenue Influenced
Revenue in deals, transactions, or renewals where AI played a material role. This is the hardest metric in the framework to measure honestly, because attributing revenue to any single input is contested even when the input is a human being. It is worth tracking with explicit caveats rather than either ignoring it or overclaiming it.
Cost Avoided
Spending that did not happen because AI absorbed the work. Deferred hiring, reduced outsourcing, and vendor contracts that were not renewed are the usual forms. Cost avoidance is more defensible than time saved, because the absence of an invoice is an observable fact rather than an estimate.
Payback Period and Net Return
How long the deployment took to pay for itself, and what it has returned since. These are the summary figures that a board asks for, and they are only as good as the four layers of input feeding them.
Risk-Adjusted Return
The value created minus what the failures and the oversight cost. This is the figure that a governance-aware organization should be reporting and that almost nobody currently reports.
The calculation draws on the other layers. The value comes from this one. The cost of failures and incidents comes from Layer 1, priced using the quality signals produced by the monitoring layer, so that a three percent fabrication rate becomes a specific number of rework hours at a specific loaded cost. The cost of governance and oversight comes from Layer 2, covering the review cycles, the risk assessments, and the audit preparation that the AI program consumed. Subtract both from the gross value and the result is a return figure that accounts for what the AI actually cost the business rather than what the vendor invoiced.
The gap between gross return and risk-adjusted return is the number that matters most in regulated industries, and it is currently invisible in essentially every AI ROI report being produced, because the platforms measuring return do not measure the cost of failure and the platforms measuring failure do not measure return.
Peer Benchmarking
How the organization's adoption and return compare with comparable companies. Benchmarking answers a question that internal metrics cannot, which is whether a result that looks good in isolation is actually behind the market.
The Credibility Problem
Most AI return figures in circulation would not survive twenty minutes with a skeptical finance director, and the people presenting them usually know it.
The standard method runs like this. Somebody surveys a team and asks how much time the AI tool has saved them. The average answer comes back at four or five hours a week. That figure is multiplied by the number of employees with a license and by a loaded hourly rate, and the product goes on a slide with a dollar sign in front of it. The slide gets presented, nobody in the room has a better number, and the budget is approved.
Then somebody asks how the four hours was measured, and the whole structure comes down.
The problem is not that these figures are dishonest. The people producing them are doing the best they can with the instruments available, which in most companies is a survey and a spreadsheet. The problem is that the method has five specific weaknesses, and a finance team that understands any one of them can dismiss the entire number. Any organization serious about proving AI return has to be able to answer all five.
Observed versus self-reported
Self-reported time savings are consistently and predictably overstated. People are poor at estimating how long a task used to take, they are motivated to justify a tool they enjoy using, and they tend to remember the cases where the AI performed impressively rather than the cases where they abandoned the output and did the work themselves. A survey measures perception of savings, and perception of savings is a real thing that is not the same thing as savings.
Observed data comes from the systems where the work happens: how long a ticket took to close before and after, how many drafts a document went through, how many minutes elapsed between assignment and completion. It is harder to collect and it does not flatter anyone, which is precisely why it holds up. When an AI return figure is challenged, the first question is where the number came from, and "we asked people" is the answer that ends the conversation badly.
Baseline
A saving is a comparison, and a comparison needs something to compare against. The uncomfortable truth in most AI deployments is that nobody measured the work before the tool arrived. The company did not know how long it took to draft a contract, resolve a ticket, or produce a report, because there was never a reason to find out. When the AI arrives and someone asks how much faster things are now, the honest answer is that there is no "before" to measure against, and the number being presented is a comparison against a collective memory.
The organizations that end up with defensible AI return figures are the ones that measured the process before they automated it. That requires deciding to measure before the tool arrives, which is a discipline that almost nothing in the current AI procurement cycle encourages.
Counterfactual
Would the improvement have happened anyway? Teams get faster over time. Processes get refined. New hires get up to speed. A support team whose resolution time dropped fifteen percent in the two quarters after an AI tool was deployed may have improved because of the AI, or because a new knowledge base went live in the same period, or because the seasonal ticket mix shifted toward easier problems.
Nobody expects a randomized controlled trial inside an enterprise. What a credible return figure requires is that somebody has thought about the alternative explanations and can say why the AI is the most plausible cause. A figure presented without that reasoning invites the finance team to supply their own alternative explanation, and they usually can.
Reallocation
Time saved becomes value only if the time went somewhere. An analyst who saves six hours a week and spends those six hours on higher-value analysis has produced a real return. An analyst who saves six hours a week and spends them absorbed into the general texture of the working day has produced a real improvement in quality of life and no measurable financial return at all.
This is the question that separates AI return claims that hold up from the ones that quietly evaporate. Companies that report enormous aggregate time savings and show no corresponding change in output volume, headcount, or cost have not found a return. They have found slack. Slack is not worthless, and it is also not the thing being claimed on the slide.
Attribution integrity
The Lanai finding is the most damning statistic in this article and the one that explains why so much AI value is invisible. Eighty-seven percent of AI-assisted output is credited to a human employee alone. The document was drafted by an assistant and revised by a person, and the record shows a person produced a document. The analysis was assembled by an agent and reviewed by an analyst, and the record shows the analyst did the work.
The consequence is structural. Every performance system the company already runs, meaning the ones tracking output, productivity, and cost per unit of work, is systematically attributing AI's contribution to the humans standing next to it. The AI's contribution does not show up as low. It does not show up at all. Any organization trying to measure AI return using the performance systems it already has is measuring with an instrument that was calibrated to ignore the thing being measured.
This is also the honest case for buying a platform in this category at all. The alternative to instrumentation is a spreadsheet built on a survey, and a spreadsheet built on a survey is exactly the artifact that a finance director is trained to take apart. Platforms earn their cost by producing observed data instead of remembered data, which is the difference between a number that gets a budget approved and a number that gets a meeting rescheduled.
Sources
Every statistic in this article traces to a named primary document. Vendor documentation is used for capability claims only and never as a source for market data.
Enterprise AI Investment and the Returns Gap
Accenture, "Pulse of Change" research, 2026. Survey of 3,650 executives. Primary source for the finding that 86% of C-suite leaders plan to increase AI investment while 32% report sustained enterprise-wide impact, that 78% expect AI to drive revenue growth, and that 21% have redesigned core processes. accenture.com/us-en/insights/pulse-of-change
Melody Brue, "Accenture Survey Finds AI Investment Surging, But Operating Models Lag," Forbes, June 24, 2026. Source for the Accenture figures as reported and for the Tom Bruss remarks at ServiceNow Knowledge 2026. forbes.com/sites/moorinsights
AI Labor Attribution and the Measurement Gap
Güney Yıldız, "Your Company Is Already Run Partly By AI. Your Accounts Don't Show It.," Forbes, June 24, 2026. Reporting on a Lanai study. Primary source for the findings that 92% of technology executives monitor AI-generated work while only 2% formally record even half of it as a business outcome, that 90% of organizations have no dedicated AI return measurement function, that 79% fear budget cuts because value is unmeasurable, and that 87% of AI-assisted output is credited to human employees alone. The related figure on shadow application usage is an estimate reported by surveyed executives rather than a measured share of work, and is treated as such here. forbes.com/sites/guneyyildiz
The Cost of AI Failures and Incidents
CrowdStrike, "CrowdStrike 2026 Global Threat Report," press release, February 24, 2026. Primary source for the documented attacks at more than 90 organizations in which adversaries injected malicious prompts into generative AI tools, the 89% year-over-year rise in AI-enabled adversary activity, and the finding that 82% of intrusions involved no traditional malware. crowdstrike.com/en-us/press-releases
Janakiram MSV, "Prompts Are The New Malware As Enterprise AI Defenses Fall Behind," Forbes, June 29, 2026. Additional reporting on the CrowdStrike findings and the OWASP ranking of prompt injection as the leading risk for LLM applications. forbes.com/sites/janakirammsv
Related GetAIGovernance Frameworks
GetAIGovernance, "AI Monitoring Signals Explained: What They Are, How They Work, and How to Evaluate AI Monitoring Platforms," June 18, 2026. The source framework for the quality signals that AI ROI measurement consumes as an input, including hallucination rate, output accuracy, and error rate. getaigovernance.net/blog/ai-monitoring-signals-explained
GetAIGovernance, "AI Governance Capabilities Explained: What Platforms Actually Do and How to Choose the Right One," June 28, 2026. getaigovernance.net/blog/ai-governance-capabilities-explained
Platform Documentation
CloudZero platform documentation, covering CostFormation, the AnyCost API, and the Cloud Efficiency Rate. cloudzero.com
Finout platform documentation, covering MegaBill, Virtual Tags, and CostGuard. finout.io
Nebuly platform documentation, covering conversation analytics, deployment models, and certifications. nebuly.com
Revenium platform documentation, covering the Tool Registry, metering, and budget guardrails. revenium.ai
Worklytics platform documentation, covering DataStream, the pseudonymization proxy, and the measurement methodology. worklytics.co
Our Take
AI ROI Take
Most organizations are trying to prove a return on AI before building the visibility, attribution, and data quality that a credible number requires. That is why so many AI return claims fall apart the moment somebody in finance asks a second question. The number was assembled from a survey, compared against a baseline that was never measured, and divided by a cost figure that counted the tokens and missed the credit report.
The platforms that will matter in this category are the ones that build the measurement infrastructure underneath the number rather than the ones with the most attractive dashboard. A dashboard reports what the instrumentation collected. If the instrumentation is a questionnaire, the dashboard is a rendering of an opinion.
The practical sequence is the same one the four layers describe. Find every dollar, including the tools nobody registered. Attribute each dollar to the team, the feature, the customer, or the agent decision that caused it, and make sure the attribution captures the external tool calls that a token bill will never show. Establish who is actually using what was bought, measured against a threshold that means something. Then, and only then, convert the usage into a value figure, and subtract what the failures and the oversight cost before calling the result a return.
That last subtraction is the one nobody is doing yet, and it is the one that separates a governance-aware AI program from a hopeful one. Browse the AI ROI category to compare platforms by the layer they actually own, and start with the question your organization cannot currently answer